A guide to programmatically extract capacity consumption by user-generated DAX queries using SemPy

Pinpointing the exact Capacity Unit (CU) consumption for every user-driven DAX query through the Fabric Capacity Metrics app is often like finding a needle in a haystack. While the app provides a high-level overview, capturing a detailed, comprehensive trail of consumption for all concurrent user activity remains a significant challenge.
In this guide, we’ll explore a more efficient programmatic approach using SemPy within Fabric Notebooks. You’ll learn how to track and extract capacity consumption for DAX queries triggered by user actions. This approach provides a practical, scalable way to monitor real-time usage and better understand how your capacity is used.
- Step 1: Capture the user-generated DAX queries
- Step 2: Extract the Capacity Unit Consumption for queries
- Step 3: Correlate CU Consumption with the DAX Queries
- Troubleshooting: Error obtaining data location
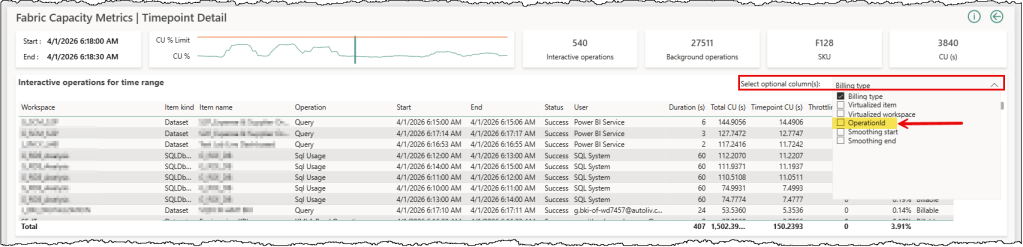
Isolating the specific CU impact of each user-generated DAX query has been challenging. Relying on user names or timestamps often leads to a guessing game. When multiple operations occur simultaneously, it is hard to pinpoint how much capacity a query consumes. Using the recently introduced Operation ID in the Fabric capacity metrics data, we can now create a direct one-to-one link between a query execution and its CU cost.
Three main steps are involved in finding the CU costs: capture the DAX queries generated by user actions along with their OperationId, extract the CU consumption for those queries using the OperationId from the Fabric Capacity Metric semantic model, and correlate the CU with the actual DAX queries. Semantic Link (SemPy) in Fabric notebooks provides us with the capabilities to do all three from one place.
Prerequisites
- Build Permissions on the target semantic model you want to monitor
- XMLA-Enabled Capacity: Both the target model and your Fabric Capacity Metrics semantic model should be hosted on an XMLA-enabled capacity. By default, the Fabric Capacity Metrics App is installed in a pro workspace. So you’ll have to move your workspace to a Fabric/Premium capacity.
- Creation Rights: You need the right to create Fabric items either in the same workspace as your target semantic model or a different workspace hosted on a Fabric/Premium capacity.
Step 1: Capture the user-generated DAX queries
SemPy offers tracing functionalities to monitor events generated in an Analysis Services engine, and each Power BI semantic model is an Analysis Services engine under the hood. Setting up a trace with SemPy is easy and only requires an understanding of which event categories and their associated columns (collectively known as an event schema) to trace.
We wrote a series of articles on tracing Power BI semantic models with SemPy, covering the basics and a few different implementation options. You can find the articles here, here, and here. We recommend a quick read to grasp the concepts and better understand this step.
To capture DAX queries generated by user actions, we only need to trace the “QueryEnd” event with a handful of useful columns. The following code snippet defines the event schema for our trace and starts a trace on the target semantic model for 60 seconds. It captures all Query End events occurring in the target semantic model during those 60 seconds and returns the trace logs at the end.
# Import the Semantic Link Python library
import sempy.fabric as fabric

# Import other libraries and modules
from datetime import datetime, timedelta
import time

import pandas as pd
import re

# Declare and assign variables

## PROVIDE THE NAME OR ID OF YOUR TARGET WORKSPACE, TARGET SEMANTIC MODEL, THE CAPACITY ID OF THE TARGET WORKSPACE ##

target_workspace = "<TARGET_WORKSPACE_NAME_OR_ID>"
target_semantic_model = "<TARGET_SEMANTIC_MODEL_NAME_OR_ID>"
target_capacity_Id = "<CAPACITY_ID_OF_TARGET_WORKSPACE>"

# Define events to trace and their corresponding columns

query_end_columns = [
  'EventClass',
  'EventSubclass',
  'RequestID',
  'ApplicationName',
  'NTCanonicalUserName',
  'SessionID',
  'ActivityID',
  'CurrentTime',
  'StartTime',
  'EndTime',
  'Duration',
  'CpuTime',
  'Success',
  'Error',
  'TextData'
]

# Define event schema with events and its associated columns
event_schema = {
    "QueryEnd": query_end_columns
}

## Duration-Bound Trace

# Run the trace for a specified duration and collect the event at the end of the interval

# Set the total duration in seconds
total_duration = 60
check_interval = 20
elapsed_time = 0

# Establish a connection to the XMLA endpoint of the specific workspace and semantic model
# Using 'with' ensures the connection is closed automatically even if the code fails

with fabric.create_trace_connection(workspace = target_workspace, dataset = target_semantic_model) as trace_connection:
    # Define a trace session on the server side using the provided event_schema (e.g., Query End)
    with trace_connection.create_trace(event_schema, "SemPyDAXQueryTrace") as trace:

        # Start the trace. The argument (5) is a delay in seconds to wait for the trace to initialize
        trace.start(5)
        print("Trace started. Monitoring activity...")

        # Loop until the total duration is reached
        while elapsed_time < total_duration:
            time.sleep(check_interval)
            elapsed_time += check_interval
            print(f"Elapsed time: {elapsed_time} seconds...")

        ### CRITICAL: Final buffer to ensure the server flushes the last events
        print("Finalizing trace and flushing buffer...")
        time.sleep(5)

        # Stop the trace and download the data
        trace_logs = trace.stop()
        print("Trace complete")

display(trace_logs)
Let’s understand this code snippet in detail
target_variables hold the target workspace, semantic model, and capacity details that we want to monitor in the trace.query_end_columnsspecifies the data columns associated with the QueryEnd event, which will be traced.event_schemais a dictionary that contains event types as keys and a list of associated data column names for that event. A trace only captures the events and columns defined in its event schema.create_trace_connectioncreates a trace connection to the specified target semantic model. We can start, view, and remove the traces on a semantic model using this connection.create_tracecreates a server-side trace with the name “SemPyDAXQueryTrace” to track the “QueryEnd” events and data columns specified in theevent_schema. The trace is created on the semantic model, and logs can be obtained either by callingget_trace_logs()or by stopping the trace.trace.start(5)starts the trace with a 5-second delay. This delay ensures that the Python engine has had enough time to register and subscribe to trace events.whilewith atime.sleep()is used to print trace status messages for tracking. This loop keeps the trace running for 60 seconds and prints a status update every 20 seconds. During the sleep period, the trace remains active and logs events; it’s the Python kernel in the Notebook that goes to sleep.time.sleep(5)adds a 5-second delay before the code execution stops the trace. The delay timer allows the semantic model to flush the remaining events into the log buffer before we stop the trace.trace_logs = trace.stop()stops the trace and retrieves the trace events as a Pandas dataframe
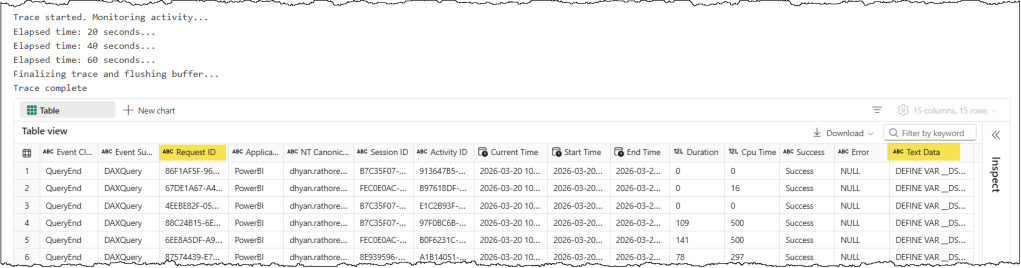
You can choose which columns you want to trace and log. The most important column for extracting CU consumption is RequestID, which corresponds to OperationId in the Capacity Metrics data. TextData is another important column, as it contains the actual full DAX query that was executed. Other columns provide additional metadata about query execution and can be helpful for monitoring and tracking query performance and CU consumption during an optimization exercise.
Step 2: Extract the Capacity Unit Consumption for queries
We will execute a DAX query against the Capacity Metric semantic model with the request IDs we’ve just captured to extract their CU consumption details. Let’s start by transforming the details we’ve just captured for our CU extraction DAX query, and we’ll discuss two important things to keep in mind when extracting CU consumption details.
TimePoint
TimePoint and smoothing are the most crucial concepts to understand while working with the Capacity Metrics data. In Fabric, each TimePoint lasts 30 seconds. Billing for each operation is divided into TimePoints, and billing starts at the next TimePoint after the operation finishes. For example, if an operation finishes at 11:01:01 or 11:01:30, billing starts at the next TimePoint, i.e., 11:01:31. It’s mandatory to specify a TimePoint when working with operation-level capacity consumption data, so we must use the correct TimePoint in our CU extraction DAX query to get the CU consumption details.
The second factor to consider is smoothing. Smoothing distributes the consumed CUs across future timepoints. In Fabric, each operation is categorized as either interactive or background. Smoothing works differently for interactive and background operations. A DAX query execution is categorized as an interactive operation. Every interactive operation is smoothed over a range of at least 5 minutes (10 TimePoints) and up to 64 minutes (128 TimePoints).
In summary, this means we don’t need an exact timestamp to retrieve CU consumption for an operation. As long as your TimePoint falls within that smoothing window, you’ll find the operation in the results. For example, if a DAX query’s CUs are smoothed over 5 minutes and the operation finished at 10:11:13, then you can find the CU details for this operation from TimePoint 10:11:31 until TimePoint 10:16:30.
To determine the TimePoint we need to use in our CU extraction DAX query, we will use the CurrentTime column from the trace logs and round it up to the next 30-second mark.
# The billing of Capacity Units starts from the beginning of the next TimePoint i.e., next 30 seconds mark.
# To automate the TimePoint in the DAX query to the Capacity Metric semantic model:
# 1. Get the current utc time in the dax_query_execution_time variable
# 2. Round up the time to the next 30 second mark
# 3. Format the time to fit the DAX query as DAX DATE() + TIME()
# This time will be used as the TimePoint in the DAX query to the Capacity Metric semantic model.

# 1. Get the maximum timestamp from the "Current Time" column
# We use pd.to_datetime just in case the column is currently a string
dax_query_execution_time = pd.to_datetime(trace_logs["Current Time"]).max()

# 2. Round up the time to the next 30 second mark
rounded_seconds = 30 if dax_query_execution_time.second < 30 else 0
extra_minutes = 1 if dax_query_execution_time.second >= 30 else 0

rounded_time = dax_query_execution_time.replace(
    second=rounded_seconds,
    microsecond=0
) + timedelta(minutes=extra_minutes)

# 3. Format the time to fit the DAX query as DAX DATE() + TIME()
operation_TimePoint = f"DATE({rounded_time.year}, {rounded_time.month}, {rounded_time.day}) + TIME({rounded_time.hour}, {rounded_time.minute}, {rounded_time.second})"

## ........ ALTERNATIVELY, SET THE TIMEPOINT MANUALLY ........ ##
# operation_TimePoint = "DATE(YYYY, MM, DD) + TIME(HH, MM, SS)"

print(operation_TimePoint)
Latency
Latency is another important point to keep in mind. There can be a delay of up to 15 minutes before the operation details become available in the Capacity Metrics semantic model. However, in most cases, 6 minutes are enough. So we must wait at least 6 minutes before running our CU extraction DAX query. The following code snippet defines a waitTime of 6 minutes.
# The details of an operation appears in the capacity metrics semantic model in approx 6 to 15 minutes
# The waitTime variable is used to set the sleep timer before running the DAX query to the Capacity Metric semantic model

## INCREASE THE WAIT TIME IF YOU DON'T GET CAPACITY UNIT CONSUMPTION DETAILS ##

# Set wait time in seconds
waitTime = 6 * 60  # 6 minutes
We also need to refine the RequestID we captured in the previous step so it’s usable in our DAX query. The following code snippet creates a list of unique, DAX-style comma-separated RequestIDs.
# "Request ID" from trace logs are referred to as "Operation Id" in Capacity Metrics
# Prepare a double quoted and comma separated list of Request IDs that will be used to track the Capacity consumption of each query
# Get unique, non-null Request IDs
unique_request_ids = trace_logs["Request ID"].dropna().unique()

# Map each ID to a double-quoted string and join them
request_id_list = ", ".join(map(lambda x: f'"{str(x).lower()}"', unique_request_ids))
CU Extraction DAX Query
The CU extraction DAX query itself is simple and self-explanatory. We use the variables defined in the previous steps to complete this query.
## PROVIDE THE NAME OR ID OF YOUR FABRIC CAPACTIY METRICS WORKSPACE AND FABRIC CAPACTIY METRICS SEMANTIC MODEL ##

capacity_metric_workspace = "<CAPACITY_METRIC_WORKSPACE_NAME_OR_ID>"
capacity_metric_semantic_model = "<CAPACITY_METRIC_SEMANTIC_MODEL_NAME_OR_ID>"

# DAX query to extract capacity consumption data from the capacity metrics semantic model

capacity_consumption_dax_query = f"""
// DAX query to return the capacity consumption by the interactive operation for a capacity during a TimePoint
DEFINE
    // Change the TimePoint MPARAMETER to get details of a desired TimePoint
    MPARAMETER 'TimePoint' =
        {operation_TimePoint}
    // Provide a capacity ID
    MPARAMETER 'CapacitiesList' = {{ "{target_capacity_Id}" }}
    VAR __OperationId =
        TREATAS ( {{ {request_id_list} }}, 'Timepoint Interactive Detail'[Operation Id] )
    VAR __TimePointInteractiveOperations =
        SUMMARIZECOLUMNS (
            'Timepoint Interactive Detail'[Operation Id],
            'Timepoint Interactive Detail'[Operation start time],
            'Timepoint Interactive Detail'[Operation end time],
            'Timepoint Interactive Detail'[Status],
            'Timepoint Interactive Detail'[Operation],
            'Timepoint Interactive Detail'[User],
            'Items'[Workspace Id],
            'Items'[Workspace name],
            'Items'[Item kind],
            'Items'[Item Id],
            'Items'[Item name],
            __OperationId,
            "Operation Duration (s)", CALCULATE ( SUM ( 'Timepoint Interactive Detail'[Duration (s)] ) ),
            "TimePoint CU", CALCULATE ( SUM ( 'Timepoint Interactive Detail'[Timepoint CU (s)] ) ),
            "Total CU", CALCULATE ( SUM ( 'Timepoint Interactive Detail'[Total CU (s)] ) )
        )

EVALUATE
__TimePointInteractiveOperations
ORDER BY
    'Timepoint Interactive Detail'[Operation start time] DESC,
    'Timepoint Interactive Detail'[Operation end time]
"""
⚠️ Note
This DAX query was tested against the Fabric Capacity Metrics App version 1036. It may not work with older or newer versions, as the semantic model structure and object names are subject to change.
Execute the CU Extraction DAX Query
We will use the evaluate_dax SemPy function to run the DAX query and display the results. The code snippet contains a while loop that waits 6 minutes before running the query, and it prints a status message every 30 seconds to indicate it’s still running.
# Wait at least 6 minutes before running the DAX query to the Capacity Metric semantic model to ensure operation details are available.
# If the extraction query runs but returns no results, try increasing the waitTime to ensure the operation details are available in the model.

remaining_wait_time = 0

print(f"Waiting for {waitTime} seconds before extracting Capacity Unit consumption from the Capacity Metric semantic model to ensure operation details are available.")

while remaining_wait_time < waitTime:
    time.sleep(30)
    remaining_wait_time += 30
    print(f"Remaining wait time: {waitTime - remaining_wait_time} seconds...")

# Execute DAX query to extract capacity consumption data from the capacity metrics semantic model
print("Getting CU consumption details!!!")

capacity_consumption_result = fabric.evaluate_dax(
    workspace = capacity_metric_workspace,
    dataset = capacity_metric_semantic_model,
    dax_string = capacity_consumption_dax_query
)

display(capacity_consumption_result)
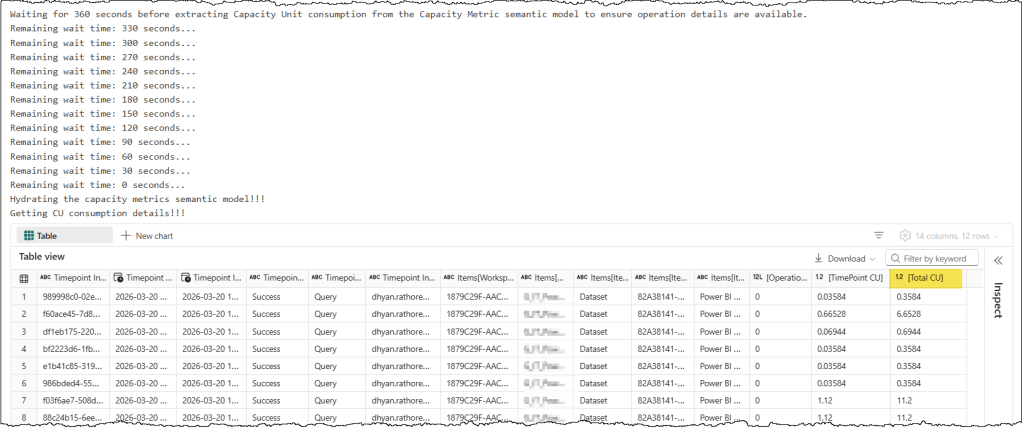
In the results, we have two CU-related columns: TimePoint CU, which indicates the CU billed at the specified TimePoint, and Total CU, which indicates the total CUs consumed by the query. You can safely disregard the TimePoint CU or exclude it from the query.
If your query runs successfully but you don’t get any results, then try increasing the wait timer. As mentioned before, it can take up to 15 minutes for operation details to be available in the Capacity Metrics semantic model. Check the troubleshooting section at the end of the article if you get an error related to data location.
Step 3: Correlate CU Consumption with the DAX Queries
The last step is to correlate the CU consumption data with the captured DAX queries by joining the two dataframes. The following code snippet cleans up the column names, then performs a join on the Request ID from the trace logs and Operation ID from the CU consumption to complete the picture.
# Rename columns in capacity_consumption_result to only keep the text within []
# This function uses regex to find the content between brackets
def extract_bracket_content(col_name):
    match = re.search(r'\[(.*?)\]', col_name)
    return match.group(1) if match else col_name

capacity_consumption_result.columns = [extract_bracket_content(col) for col in capacity_consumption_result.columns]

# Join the two dataframes
# We create temporary normalized columns to perform the join
trace_logs['join_key'] = trace_logs['Request ID'].str.lower()
capacity_consumption_result['join_key'] = capacity_consumption_result['Operation Id'].str.lower()

# Perform the join
merged_df = pd.merge(
    trace_logs,
    capacity_consumption_result,
    on='join_key',
    how='left'
)

# Show the requested columns
# We drop the temporary join_key and select the specific columns
capacity_consumption_by_query = merged_df[['Request ID', 'Duration', 'Cpu Time', 'Total CU', 'Operation Duration (s)', 'Text Data']]

display(capacity_consumption_by_query)
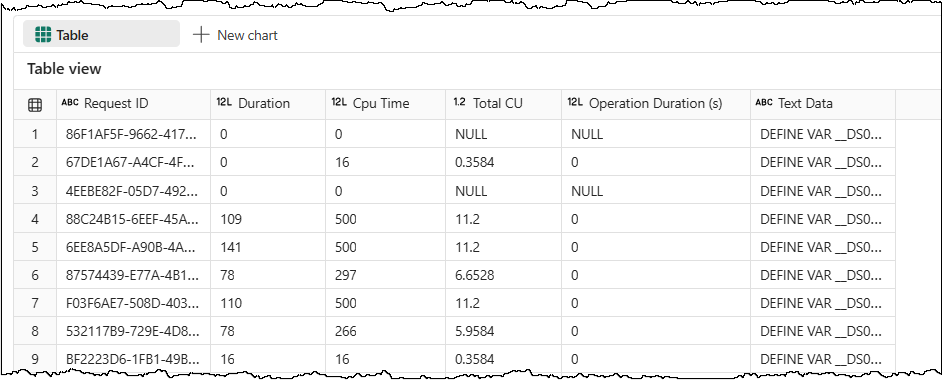
You may notice that for some queries, we do not get any CU consumption details. One explanation is that those queries were fulfilled by the cache maintained by the semantic model and didn’t reach the capacity metrics meter at all. It can happen when the same filter is available on multiple pages of a report, and the user jumps from one page to the next. Queries of those filters don’t need to be evaluated for all such cases and can be fulfilled from the cache.
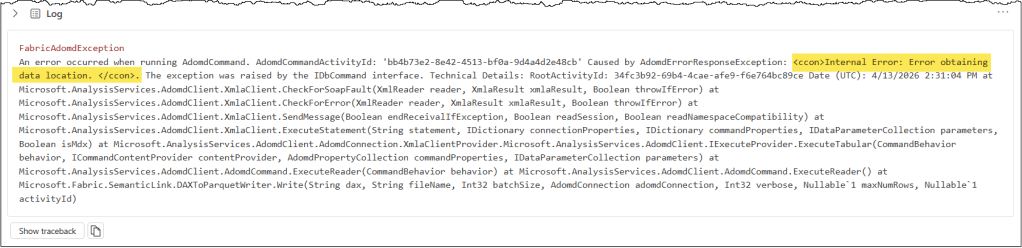
Troubleshooting: Error obtaining data location
If you’ve not opened your Capacity Metrics report for a while, then your CU extraction DAX query might fail with an “Error obtaining data location” error.
There are two ways to fix this:
- Open the Capacity Metrics report and wait until the “Health” page has fully loaded.
- Run a “hydration” query from the Notebook to hydrate your Capacity Metrics semantic model.
The query is straightforward and uses the MPARAMETER ‘RegionName’ to aggregate capacity utilization for all capacities you have access to. The results can be safely discarded.
# DAX query to hydrate the capacity metrics semantic model

hydrate_the_model_dax_query = f"""
DEFINE
    MPARAMETER 'RegionName' = "Default"

EVALUATE
SUMMARIZECOLUMNS (
    'Capacities'[Capacity Id],
    'Capacities'[Capacity name],
    "Average_Utilization", 'All Measures'[Average utilization (last 1 hour)]
)
"""
We recommend combining the hydration query execution with your CU extraction query execution to ensure you don’t get the error at all. Here’s the code snippet.
# Wait at least 6 minutes before running the DAX query to the Capacity Metric semantic model to ensure operation details are available.

# If you have not opened your Capacity Metrics report in Power BI for some time, running the Capacity Unit extraction query may fail with an "Error obtaining data location" error.
# To fix this, run a "hydration" query to refresh your model so the data loads into memory and the extraction query works without errors.

# If the extraction query runs but returns no results, try increasing the waitTime to ensure the operation details are available in the model.

remaining_wait_time = 0

print(f"Waiting for {waitTime} seconds before extracting Capacity Unit consumption from the Capacity Metric semantic model to ensure operation details are available.")

while remaining_wait_time < waitTime:
    time.sleep(30)
    remaining_wait_time += 30
    print(f"Remaining wait time: {waitTime - remaining_wait_time} seconds...")

# Execute DAX query to hydrate the capacity metrics semantic model
print("Hydrating the capacity metrics semantic model!!!")

hydrate_the_model_result = fabric.evaluate_dax(
    workspace = capacity_metric_workspace,
    dataset = capacity_metric_semantic_model,
    dax_string = hydrate_the_model_dax_query
)

# Execute DAX query to extract capacity consumption data from the capacity metrics semantic model
print("Getting CU consumption details!!!")

capacity_consumption_result = fabric.evaluate_dax(
    workspace = capacity_metric_workspace,
    dataset = capacity_metric_semantic_model,
    dax_string = capacity_consumption_dax_query
)

display(capacity_consumption_result)
You can find the complete Fabric notebook here.
Now that you have the DAX queries along with their performance metrics and CU consumption details, you can store them in a lakehouse for future reference or measure the impact of your optimization efforts.
Further reading
If you’re exploring different ways to extract data from the Fabric Capacity Metrics App, check out our detailed guide covering various tools and methods to connect and retrieve data.
We also have an article that explains how to extract the memory size of all semantic models, either within a single capacity or across multiple capacities, from the Capacity Metrics App.

Leave a comment