Tracing & capturing user-generated DAX queries using SemPy

When a user interacts with a Power BI report, the engine generates specific DAX queries to fetch the required data. Capturing these queries is essential for understanding how a report performs in the real-world. Two of the most common reasons to trace this activity are to optimize slow DAX and to troubleshoot “wrong numbers” reported by a specific user. After all, DAX is basically the dark magic of Power BI, invisible, mysterious, and prone to sprinkling filters when you didn’t ask for it.
In this post, we’ll explore how to use Semantic Link (SemPy) within Fabric Notebooks to programmatically trace and extract these queries in real-time. This approach turns user session events into actionable data for optimization and long-term auditing.
In our earlier articles, we laid the groundwork for Analysis Service tracing, covering everything from prerequisites to the nuances of event schemas and troubleshooting common errors. We also touched on the basics of executing and tracing a DAX query using SemPy. To get the full picture and ensure you’re ready for the more advanced use case we’re covering today, we highly recommend revisiting those foundational guides here and here.
Tracing User-Generated DAX Queries
The first step is to define your monitoring goals to select the right events and columns to trace (collectively known as the event schema). Let’s say you’re auditing performance and want to capture and store the DAX queries generated during a testing session.
To capture DAX queries for storage or further analysis, it’s sufficient to trace the QueryEnd event as the queries are available in the TextData column. We will add a couple of other columns in our event schema for logging and tracking purposes.
# Import the Semantic Link Python library
import sempy.fabric as fabric
import time

## NAME OR ID OF THE TARGET WORKSPACE AND THE TARGET SEMANTIC MODEL
target_workspace = "<TARGET_WORKSPACE_NAME_OR_ID>"
target_semantic_model = "<TARGET_SEMANTIC_MODEL_NAME_OR_ID>"

# Define events to trace and their corresponding data columns
query_end_columns = [
    "EventClass",
    "EventSubclass",
    "RequestID",
    "ApplicationName",
    "NTCanonicalUserName",
    "SessionID",
    "ActivityID",
    "DatabaseName",
    "CurrentTime",
    "StartTime",
    "EndTime",
    "Duration",
    "CpuTime",
    "Success",
    "Error",
    "TextData"
]

# Define event schema
event_schema = {
    "QueryEnd": event_query_end_columns
}
One important point to note is that the DAX queries will be logged without direct information about the visual that generated them. While this context is available in the ApplicationContext column, it comes as nested JSON.
At the time of writing, SemPy traces do not support parsing nested JSON. As a result, including ApplicationContext in the event_schema causes the trace to fail. To avoid errors, exclude the column from the event schema.
The exact code depends on what you want to monitor and how much control you need over the trace. You can do this in two ways:
- Bounded Trace: A bounded trace includes a well-defined exit condition that terminates the trace and collects the event data. The exit could be triggered by a timer, an event, or the status of an operation.
- Unbounded Trace: An unbounded trace doesn’t specify an exit condition.
Duration-Bound Trace
With a duration-bound trace, you run the trace for a predefined duration (e.g., 5 minutes). Once the time window expires, the trace stops automatically. This approach is ideal when you want to capture activity within a clearly defined time frame.
This sample code shows how to set up a duration-bound trace that monitors a semantic model for DAX queries for 5 minutes. It collects only QueryEnd events and logs a status message every 20 seconds to confirm the trace is running.
## Duration-Bound Trace
# Run the trace for a specified duration and collect the event at the end of the interval
# Set the total duration in seconds
total_duration = 300
check_interval = 20
elapsed_time = 0
# Establish a connection to the XMLA endpoint of the specific workspace and semantic model
# Using 'with' ensures the connection is closed automatically even if the code fails
with fabric.create_trace_connection(workspace = target_workspace, dataset = target_semantic_model) as trace_connection:
# Define a trace session on the server side using the provided event_schema (e.g., Query End)
with trace_connection.create_trace(event_schema, "SemPyDAXQueryTrace") as trace:
# Start the trace. The argument (5) is a delay in seconds to wait for the trace to initialize
trace.start(5)
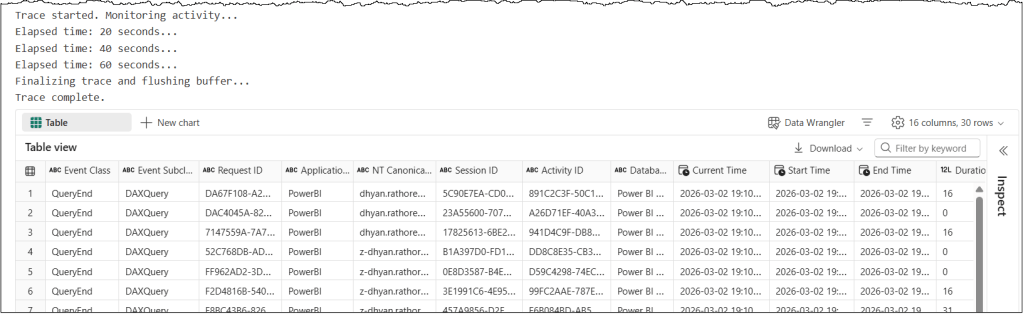
print("Trace started. Monitoring activity...")
# Loop until the total duration is reached
while elapsed_time < total_duration:
time.sleep(check_interval)
elapsed_time += check_interval
print(f"Elapsed time: {elapsed_time} seconds...")
### CRITICAL: Final buffer to ensure the server flushes the last events
print("Finalizing trace and flushing buffer...")
time.sleep(5)
# Stop the trace and download the data
trace_logs = trace.stop()
print("Trace complete.")
display(trace_logs)
A few pointers about this code snippet
event_schemacontains event types and a list of associated data column names for each event in PascalCase.create_trace_connectioncreates a trace connection to the specified target semantic model.create_tracecreates a server-side trace with the name “SemPyDAXQueryTrace” to track the “QueryEnd” events and data columns specified in theevent_schema. The trace is created on the semantic model, and logs can be obtained either by callingget_trace_logs()or by stopping the trace.trace.start(5)starts the trace with a 5-second delay. This delay ensures that the Python engine has had enough time to register and subscribe to trace events.whilewith atime.sleep()is used to print trace status messages for tracking. This loop keeps the trace running for 5 minutes and prints a status update every 20 seconds. During the sleep period, the trace remains active and logs events; it’s the Python kernel in the notebook that goes to sleep.time.sleep(5)adds a 5-second delay before the code execution stops the trace. The delay timer allows the semantic model to flush the remaining events into the log buffer before we stop the trace.trace_logs = trace.stop()stops the trace and retrieves the trace events as a Pandas dataframe
There are other variations of the bounded approach you can use depending on your scenario:
- Event-Bound Trace: An event-bound trace runs until a specific event occurs within the set duration. The trace stops logging new events when the
stop_eventis detected and exits automatically after thetimeout. This is useful when you want to capture activity leading up to or surrounding a known trigger. - Status-Bound Trace: A status-bound trace is useful for monitoring activity based on the state of a specific operation, such as a data refresh. In this approach, your code checks the operation’s status at regular intervals. You stop the trace depending on the operation’s status. This method is useful when timing depends on the system’s state rather than on a fixed duration or a single-event trigger.
Unbounded Trace
You can start the trace without defining an end time, and it continues collecting event data until you explicitly call stop(). This method is useful during exploratory testing or troubleshooting sessions where the end time isn’t predictable.
⚠️ Note: Remember to properly clean up your trace connection and session to avoid leaving open connections.
Here’s a sample code snippet for a manual trace to monitor DAX queries. In Fabric notebooks, the implementation is split across two cells.
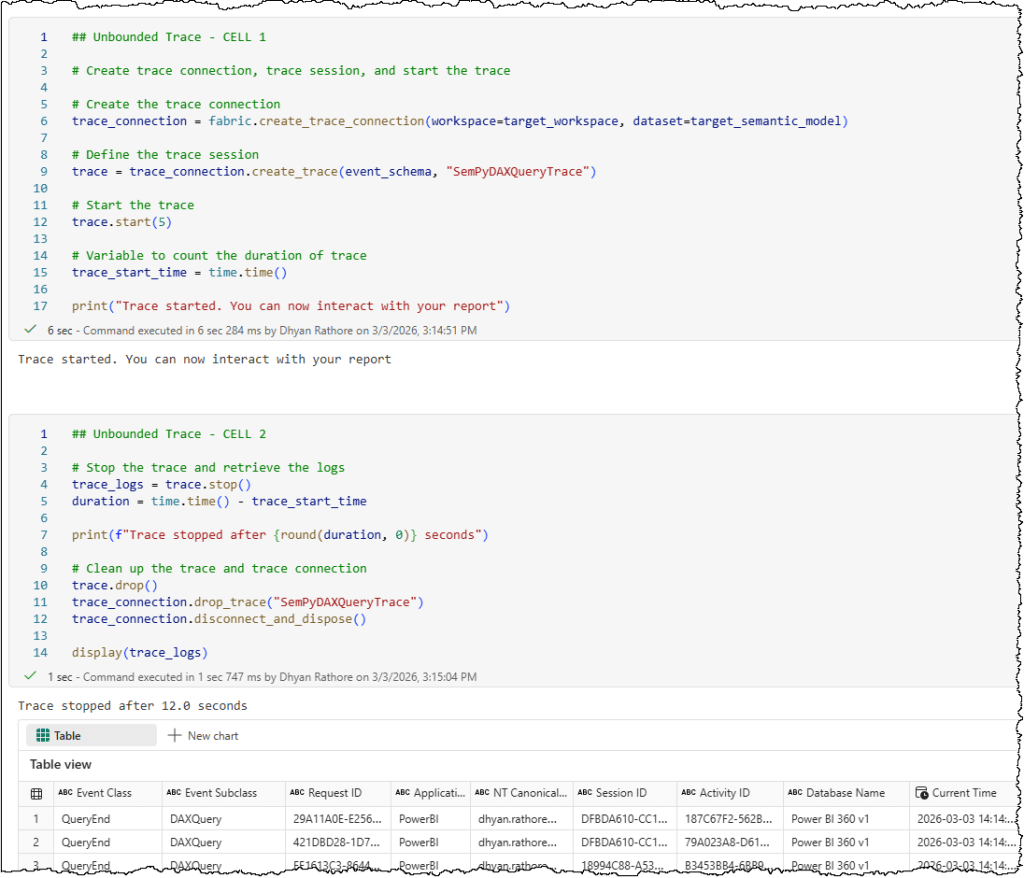
- First cell: Creates the trace connection, initializes the trace session, and starts the trace.
## Unbounded Trace - CELL 1

# Create trace connection, trace session, and start the trace

# Create the trace connection
trace_connection = fabric.create_trace_connection(workspace=target_workspace, dataset=target_semantic_model)

# Define the trace session
trace = trace_connection.create_trace(event_schema, "SemPyDAXQueryTrace")

# Start the trace
trace.start(5)

# Variable to count the duration of trace
trace_start_time = time.time()

print("Trace started. You can now interact with your report")
- Second cell: Stops the trace, retrieves the collected data from the server, and cleans up by properly disposing of the trace session and connection.
## Unbounded Trace - CELL 2

# Stop the trace, retrieve the logs, and clean up the session and connection

# Stop the trace and retrieve the logs
trace_logs = trace.stop()
duration = time.time() - trace_start_time

print(f"Trace stopped after {round(duration, 0)} seconds")

# Clean up the trace and trace connection
trace.drop()
trace_connection.drop_trace("SemPyDAXQueryTrace")
trace_connection.disconnect_and_dispose()

display(trace_logs)
Note: We also discussed some typical errors and their resolutions in our previous article. If you run into errors, check out this article for troubleshooting help.
You can find a detailed Fabric notebook here.
Now that you’ve captured the DAX queries into a dataframe, the next step could be to store it in your lakehouse as a delta table or file for long-term use.
The functionalities we have covered in this article represent only some of the methods and attributes available in SemPy. To design the most efficient solutions for your specific use cases, we recommend a thorough review of the full tracing documentation to understand how these features can be combined.
Next Steps
Identifying what is running is only the first step; understanding how it performs is where the real optimization happens. While extracting DAX queries gives you visibility, knowing their ‘cost’ in Capacity Units (CUs) gives you control.
In our next guide, we’ll show you how to use SemPy to bridge the gap between your captured queries and the Fabric Capacity Metrics App, allowing you to link DAX queries to their real-time capacity consumption.

Leave a comment