A beginner’s guide to programmatically trace Power BI operations using SemPy

SQL Server Profiler and DAX Studio have long served as the standard for ad hoc, on-demand Power BI monitoring. Each has distinct limitations; for instance, DAX Studio lacks the flexibility to select specific events or data columns and is limited to queries generated by semantic models. Conversely, SQL Server Profiler is notorious for performance lag, often freezing or becoming entirely unresponsive under heavy loads.
Semantic Link (SemPy) in Fabric Notebooks gives you a new way to monitor Power BI in real time with code. Instead of relying on external tools, you can use SemPy’s built-in functions to monitor semantic model events directly in your workspace. In this post, we’ll go over how to use SemPy to make Power BI monitoring quicker, easier, and more dependable.
Before diving into SemPy, it’s worth taking a quick look at trace events, a fundamental concept for monitoring semantic models.
Analysis Services Trace Events
Trace events are the diagnostic pulse of the Analysis Services engine, providing a granular, real-time view of every action within the engine. Since every Power BI semantic model is essentially an Analysis Services tabular instance under the hood, these events reveal exactly what is going on in the engine. Trace events are logically grouped into categories to help us quickly find related activities, and each trace event contains a set of data columns relevant to the event. These categories also help us focus only on trace events relevant to our monitoring requirements.
A detailed description of all the trace events and categories is beyond the scope of this article. You can read about the trace events here. A few event categories that are important for monitoring Power BI semantic models are the following:
- Queries Events: Tracks the lifecycle of DAX or MDX queries from the moment they arrive at the engine until the results are returned. They are the primary source for monitoring user activity and overall report responsiveness.
- Query Processing Events: Provides a deeper look into how the engine actually executes a query. They detail the “behind-the-scenes” work, such as formula engine operations and storage engine (VertiPaq) scans, which are essential for pinpointing exactly why a specific query is slow.
- Progress Reports Events: Monitors the state of data refresh and processing operations. This is the go-to category for troubleshooting refresh operations and failures.
- Job Graph Events: Offers visibility into the parallel execution of tasks within the engine. They describe how the engine breaks down complex operations into a “graph” of smaller jobs.
- Execution Metrics Events: Provides quantitative data about the resources consumed during an operation. They include metrics such as CPU time, memory usage, row counts, etc.
While it might sound technical, the concept is straightforward once you see it in action. Both DAX Studio and SQL Server Profiler rely on these same trace events to monitor semantic models. DAX Studio simplifies the process by automatically capturing queries and processing events with a single click. In contrast, SQL Server Profiler offers greater manual flexibility, allowing you to hand-pick from the full spectrum of available event types to suit your specific monitoring needs.
Tracing Semantic Model Events with SemPy
Prerequisites
Trace events can only be started and captured using the XMLA endpoint. To capture trace events using SemPy, you must meet these requirements:
- XMLA Enabled: At least the “XMLA read-only” setting must be enabled on the capacity backing the workspace.
- Model Permissions: You must have an Admin or Member role in the workspace.
- Creation Rights: You need the right to create Fabric items either in the same workspace as your target semantic model or a different workspace hosted on Premium or Fabric capacity.
Tracing with SemPy
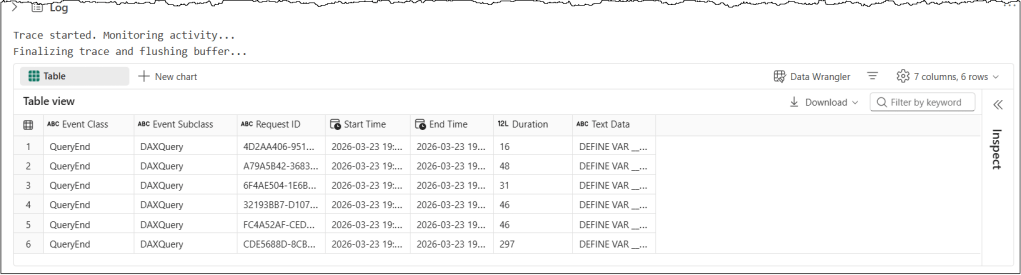
Let’s look at a simple example, then dig into the details to understand the code and concepts. The following code snippet runs a trace on a semantic model for 15 seconds and returns the “QueryEnd” events.
# Import the Semantic Link Python library
import sempy.fabric as fabric
import time

## NAME OR ID OF THE TARGET WORKSPACE AND THE TARGET SEMANTIC MODEL
target_workspace = "<TARGET_WORKSPACE_NAME_OR_ID>"
target_semantic_model = "<TARGET_SEMANTIC_MODEL_NAME_OR_ID>"

# Define events to trace and their corresponding data columns
query_end_columns = [
    "EventClass",
    "EventSubclass",
    "RequestID",
    "StartTime",
    "EndTime",
    "Duration",
    "TextData",
]

# define event_schema
event_schema = {"QueryEnd": query_end_columns}

# Establish a connection to the XMLA endpoint of the specific workspace and semantic model
# Using 'with' ensures the connection is closed automatically even if the code fails

with fabric.create_trace_connection(workspace=target_workspace, dataset=target_semantic_model) as trace_connection:
    # Define a trace session on the server side using the provided event_schema (e.g., Query End)
    with trace_connection.create_trace(event_schema, "SemPyTrace") as trace:

        # Start the trace. The argument (5) is a delay in seconds to wait for the trace to initialize
        trace.start(5)
        print("Trace started. Monitoring activity...")

        ### DO SOMETHING HERE

        # Sleep for 15 seconds to delay the code execution from stopping the trace
        ### CRITICAL: Wait for the server to flush the remaining events into the log buffer before we stop the trace
        time.sleep(15)

        # Stop the server-side trace and download the captured event data into a pandas DataFrame
        print("Finalizing trace and flushing buffer...")
        trace_logs = trace.stop()

display(trace_logs)
Let’s understand this code snippet in detail
target_variables hold the target workspace and semantic model details, which we want to monitor with the tracequery_end_columnsspecifies the data columns associated with the QueryEnd event, which will be tracedevent_schemais a dictionary that contains event types as keys and a list of associated data column names for that event as values in PascalCase. It’s the most important concept in this code. More on it in the next section.create_trace_connectioncreates a trace connection to the specified target semantic model. We can start, view, and remove the traces on a semantic model using this connection.create_tracecreates a server-side trace with the name “SemPyTrace” to track the events and data columns specified in theevent_schema. The trace is created on the semantic model, and logs can be obtained either by callingget_trace_logs()or by stopping the trace.trace.start(5)starts the trace with a 5-second delay. This delay ensures that the Python engine has had enough time to register and subscribe to trace events.time.sleep(15)adds a 15-second delay before the code execution stops the trace. In our scenario, this delay ensures the trace remains active for 15 seconds. During the sleep period, the trace remains active and logs events; it’s the Python kernel in the notebook that goes to sleep. In other scenarios, we always add a delay timer to allow the semantic model to flush the remaining events into the log buffer before we stop the trace.trace_logs = trace.stop()stops the trace and retrieves the trace events as a Pandas dataframe
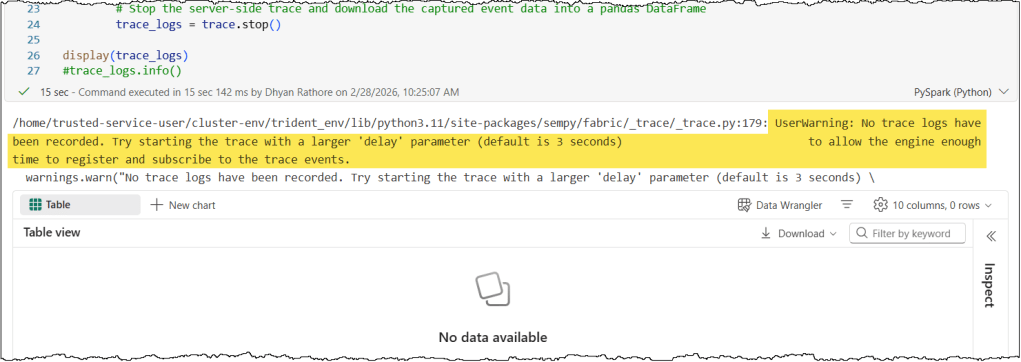
Troubleshooting: Why is my trace empty?
- When you start a trace, there is often a brief delay while the engine sets everything up and subscribes to the necessary events. This delay can vary, so if you notice that events aren’t appearing in your trace, you should try increasing the delay parameter when you start the trace.
- It is also a good idea to extend the sleep timer. This delay gives the server extra breathing room to finish sending all the events to your trace before the trace is stopped. Because communication between the Analysis Services server (the semantic model in this case) and its clients (the Python kernel in the notebook) is asynchronous, the system records events on a best-effort basis. Hence, the exact timing depends heavily on the semantic model’s current load.
Event Schema
The most important step is to define your monitoring goals to select the right trace events and data columns. This means specifying which events and, for each event, which data columns to trace, collectively known as an event schema. While you can expand your trace later, a well-defined event schema ensures you capture only the data necessary for your scenario.
In our previous example, we traced the “QueryEnd” events generated when a query finishes executing on the Analysis Services server, along with a subset of data columns associated with these events. Since the event schema is a dictionary, we can specify multiple events and their data columns in a trace. In the following code snippet, we specify both “QueryBegin” and “QueryEnd” events. Note that all events and data columns must be in PascalCase.
# Define events to trace and their corresponding data columns

query_begin_columns = [
    "EventClass",
    "EventSubclass",
    "RequestID",
    "StartTime",
    "TextData",
]

query_end_columns = [
    "EventClass",
    "EventSubclass",
    "RequestID",
    "StartTime",
    "EndTime",
    "Duration",
    "TextData",
]

# define event_schema
event_schema = {
    "QueryBegin": query_begin_columns,
    "QueryEnd": query_end_columns
}
It is important to remember that your trace will only capture the specific events and data columns defined in your event schema. Any data outside of this definition is not registered. Think of the event schema as a filter: it determines exactly which events are captured and passed through to you, while everything else is ignored.
This naturally raises a key question about event schema: how do you locate the full list of available categories and their specific columns? SemPy makes this easy with the discover_event_schema() method to retrieve a complete list of all available event categories and their associated columns.
# Import the Semantic Link Python library
import sempy.fabric as fabric

## NAME OR ID OF THE TARGET WORKSPACE AND THE TARGET SEMANTIC MODEL
target_workspace = "<TARGET_WORKSPACE_NAME_OR_ID>"
target_semantic_model = "<TARGET_SEMANTIC_MODEL_NAME_OR_ID>"

# Establish a connection to the XMLA endpoint of the specific workspace and semantic model
# Using 'with' ensures the connection is closed automatically even if the code fails
with fabric.create_trace_connection(workspace = target_workspace, dataset = target_semantic_model) as trace_connection:
    # Discover all event types and their associated columns
    discover_events = trace_connection.discover_event_schema()

print("Total Events with Data Columns: ", len(discover_events))

display(discover_events)
Tip: discover_event_schema() is a method of the TraceConnection class. So you must first establish a connection to the server before you can call it.
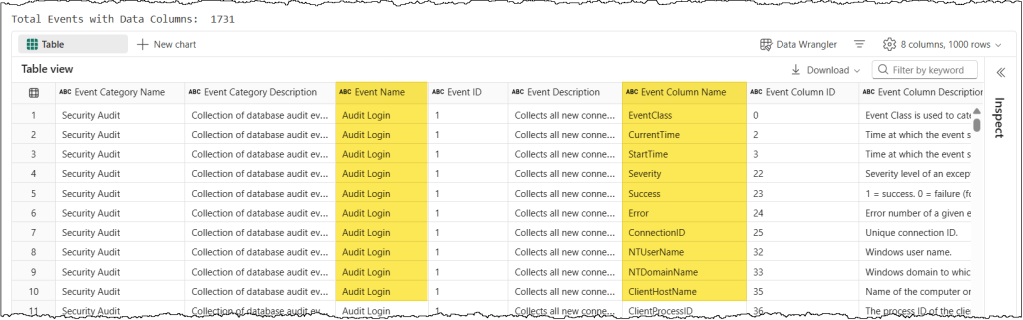
In the resulting dataset, the most critical columns are Event Name and Event Column Name. While you can copy the event column names exactly as they appear, the event names require a manual adjustment: they must be converted to PascalCase (e.g., “Query Begin” becomes “QueryBegin”) to be compatible with the trace event schema. With these details in hand, you can easily build an event schema that captures exactly what you need.
Troubleshooting: Why is my event schema failing?
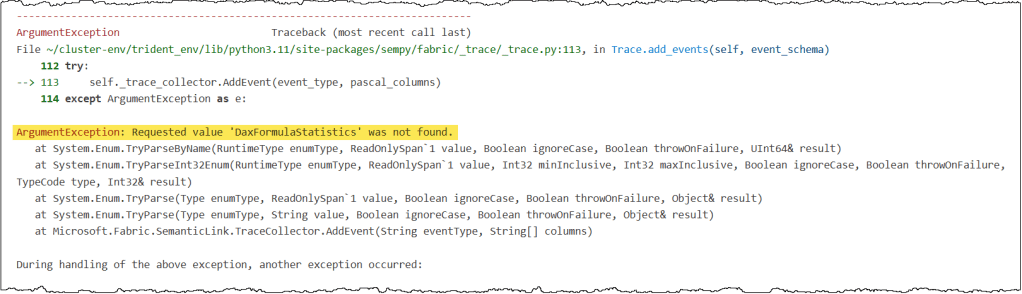
It is natural to assume that if you have correctly defined your events and columns based on the discover_event_schema(), everything should run perfectly. However, several “gotchas” can still trigger errors.
- Unsupported Events: Not every event listed in the
discover_event_schema()is actually available for tracing. For example, DAX Formula Statistics appears in the list but will trigger a “not found” error when you try to use it. If you have verified your spelling and the error persists, likely, the event isn’t exposed for tracing in SemPy. The best fix is to remove these specific events from your schema.
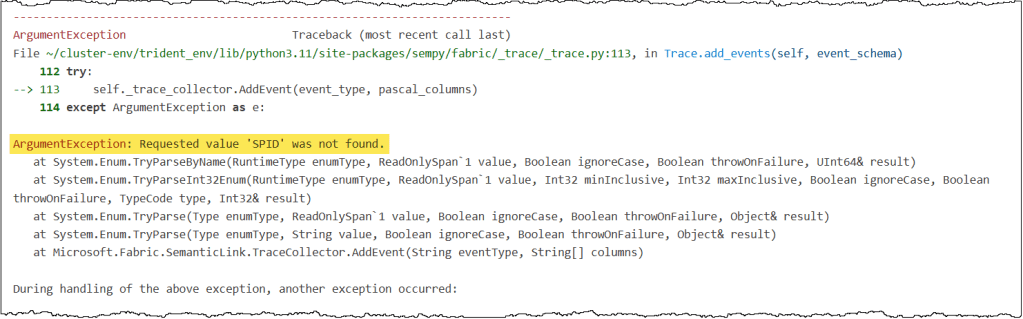
- Unsupported Columns: A similar “not found” error applies to certain data columns, such as SPID. Even though they appear in the
discover_event_schema()results, they may not be available for tracing. If a column causes an error despite being named correctly, exclude it from your schema.
Some errors are a bit more subtle. If you see a message suggesting you increase the delay timer, it usually points to one of three things:
- No Matching Events to Trace: Since you started the trace, no matching events, as specified in your event schema, have been triggered on the server. Ensure your event schema targets the correct events, and there is actual activity that results in those events.
- Server Load: Your semantic model is currently overloaded, and the server hasn’t had enough time to register or write the events to your trace. Increasing the delay and sleep timers will help you resolve this issue.
- Complex Data Parsing: Certain columns contain nested JSON values that the trace object struggles to parse into a Pandas dataframe. Complex columns such as ApplicationContext, Identity, and DatabaseFriendlyName are common issues.
If your event schema is correct, matching activities are triggering on the server, and increasing the delay does not resolve the issue, a nested JSON column is likely the cause. In the above screenshot, the ApplicationContext column was the source of the error in this instance. Simply removing the column from the event schema resolved the error.
And that’s a wrap! Tracing can do a lot more than what we covered here. If you’re interested in the “pro” stuff, take a look at some related posts below.
Conclusion
Understanding what’s happening inside the Analysis Services engine doesn’t have to be a mystery. Trace events offer a real-time window into your engine’s actions, and SemPy makes it possible to manage them all through code.
In this post, we explored how to use SemPy to monitor your semantic models and how to define the right event schema to capture exactly the data you need. With these tools in your kit, you’re ready to explore what’s happening inside your models.
Next Steps
Tracing is incredibly useful for monitoring DAX query execution. To see this in action, check out our article on executing and monitoring DAX queries with SemPy from a Fabric Notebook. Read the full article here.
Tracing is also a lifesaver for troubleshooting. You can use tracing to log user-generated DAX queries. This makes it much easier to analyze real-world performance or debug those tricky “the data looks wrong” support tickets.

Leave a comment