A summary of tools and data extraction options from the Fabric Capacity Metrics Semantic Model (or any other semantic model)

Most people would agree that the Fabric Capacity Metrics App (or simply the metrics app) could be designed to deliver a more optimal user experience. Despite the design and UX, the app is a treasure trove of information for capacity and tenant admins. It is the only means of observing and monitoring Fabric capacities.
One severe limitation of the metrics app is data availability: it can only show data for the last 14 days aggregated over the previous 14 days. But what if we want to retain this data for future use or need more granular data to build custom reporting solutions?
This article will examine the different options and methods for connecting to and extracting data from the Fabric Capacity Metrics semantic model.
Before digging into the extraction options, let’s clear out some basics. You should be a capacity admin to be able to install the app. Alternatively, ask your capacity admins to share the app with you so you can access the metrics without being a capacity admin yourself. In addition, you need access to the workspace and semantic model build permissions for most of the methods described in this article. The easiest option is to get a workspace-level role except for the “Viewer”.
If you’re unfamiliar with the Fabric Capacity Metrics app, we recommend reviewing Microsoft’s documentation to understand the basics and then installing the app. Follow the steps to configure parameters and credentials until the app is fully set up.
The app is built on a single report and a semantic model. The report only shows data from the last 14 days. To store the data for a longer period for audit or other reporting purposes, you must build your custom solution to extract and visualize it.
By default, the workspace hosting the metric app is hosted on the shared capacity, and there’s a good reason for that. Shared capacity ensures that your app is always available, which might not happen if you host it at a dedicated Fabric/Premium capacity and the capacity goes down. In addition, hosting on a dedicated capacity means that your capacity will be billed for using the metrics app.
However, a shared capacity limits the options and tools for connecting to and exporting data from the metrics semantic model. As you read through the article, these limitations will become evident.
Let’s look at some manual and simple extraction and reporting options that you could use without any additional setup.
Except for exporting data from visuals, all other methods necessitate that the user has build permissions for the capacity metric semantic model.
Manual Extraction and Reporting
Export data from the visuals
The most common and straightforward option for extracting data is to export it as Excel or CSV directly from the visuals. You can use the slicers, filters, and column selectors to fine-tune what you need to a limited extent.
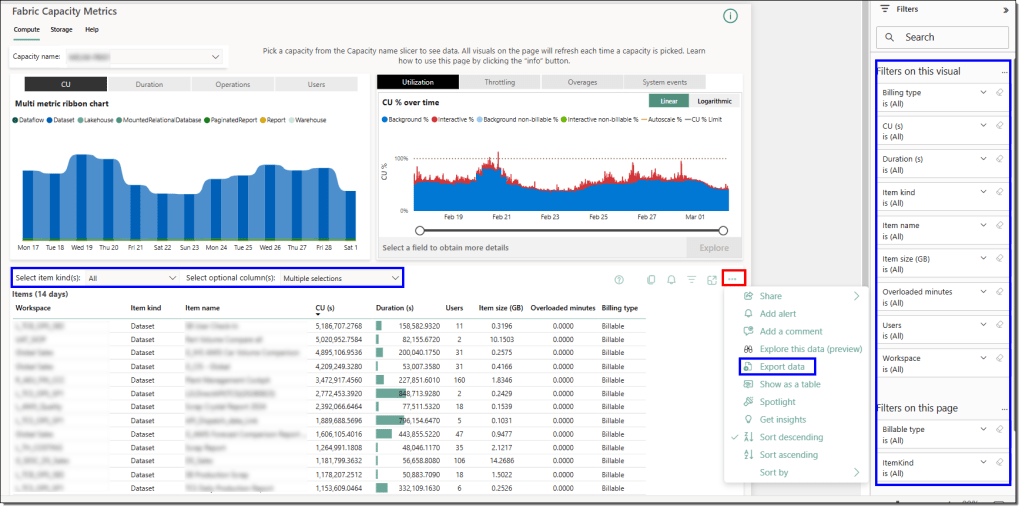
An important fact to remember is that the data you see in the visuals is either aggregated over the last 14 days or sampled over the previous 14 days to present an almost accurate picture of the actual resource consumption.
A manual Excel extract should be enough if your data extraction requirements can be satisfied despite these constraints. Unless you want to automate the extraction, read on.
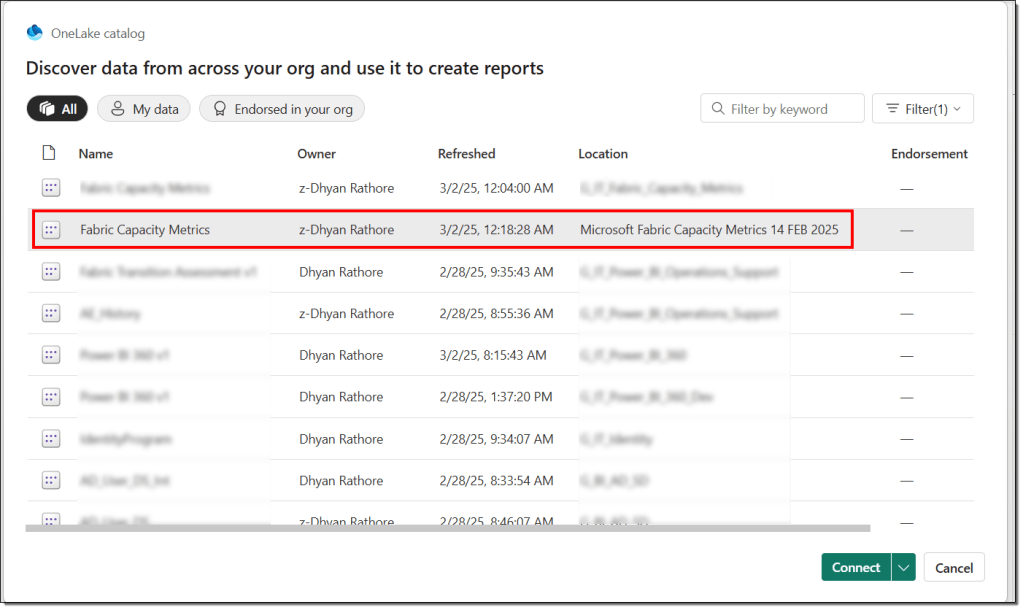
Power BI reports with Live Connection
The second option is to build a Power BI report by connecting to the metric report’s semantic model in live connection mode. This gives you more flexibility over the visuals and insights.

However, it does come with caveats, such as having limited options to merge the data with other data sources, sharing the report with a broader audience as every user needs access to the metric semantic model, and limiting the data availability to only 14 days.
DAX Queries
DAX queries offer a powerful method to query and extract data at a granularity different than that available in the visuals. One of the go-to tools to execute ad-hoc DAX queries is the DAX query editor in the Power BI Service. However, if your metrics workspace is hosted in a shared capacity, you can’t use the web DAX query editor. However, you can use the DAX query editor in the Power BI Desktop to connect to the metrics semantic model via a live connection.
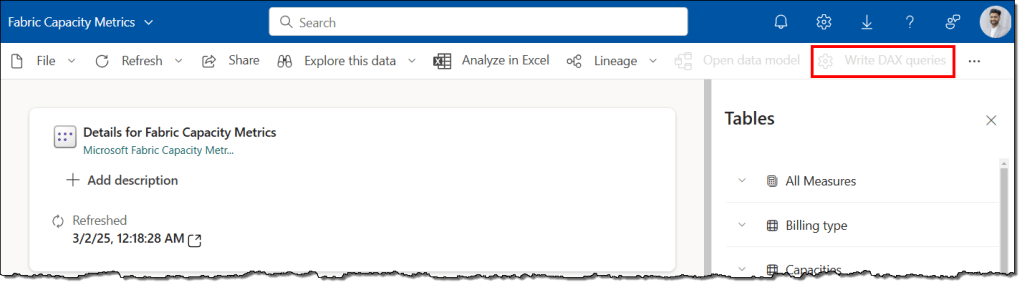
Moving the metrics workspace to a dedicated workspace enables the web DAX query editor, making it the perfect tool for running ad-hoc DAX queries and exporting data whenever necessary.

Power BI REST API from Microsoft Learn
An alternate option is to use the Power BI REST API to execute the DAX queries against the metric semantic model. The Microsoft Learn portal offers an out-of-the-box setup free feature to try the REST APIs. It provides the perfect option for ad-hoc querying and data extraction. The REST APIs work regardless of whether the workspace is hosted on a shared or dedicated capacity.

There are a handful of limitations that you should keep in mind while executing DAX queries via REST API, such as the number of rows returned, maximum data size (15 MB per query), throttling imposed at the user level (120 query requests per minute per user), only DAX queries are supported (MDX, INFO functions and DMV queries are not supported), etc.

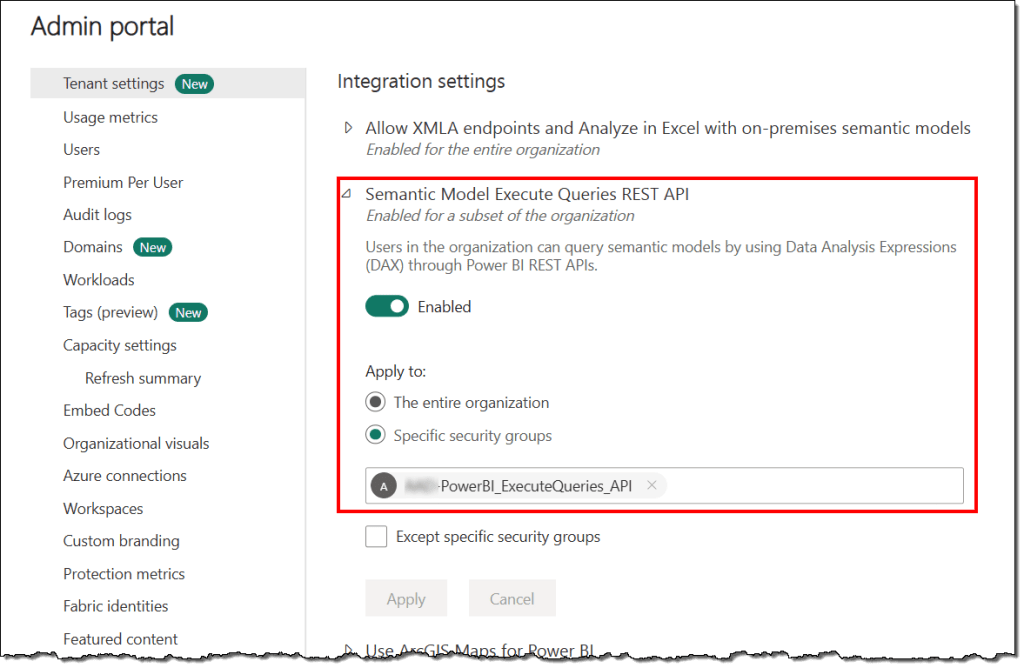
Another vital aspect to remember is that the tenant setting Semantic model Execute Queries REST API must be enabled, or you should be on the allowed list of users.
You could use any tool (e.g., RESTED, Postman, PowerShell, Python, etc.) that allows you to call REST APIs with a Bearer token to execute the DAX query. However, they may require some setup, additional manual steps, and a service principal.
All these tools and interfaces offer a quick, no-setup approach to querying and manually extracting data from the metrics app. They could be helpful and sufficient for ad hoc requirements and peeking inside the capacity metrics. But what if you need to extract granular data at a fixed interval to build your custom KPIs or monitoring solution?
Exploration
The first step towards addressing such needs is thoroughly exploring and understanding the semantic model. Understanding the data model, relationships, tables, measures, etc., will help you author advanced DAX queries to extract the data required to build custom KPIs and monitoring solutions.
Unfortunately, as long as your metrics workspace remains in a shared capacity, you’ll be limited by the tools you can use. The first step to exploring the metrics semantic model and automating your data extraction process is to move your metrics workspace to a dedicated capacity. Earlier, we discussed the risks and costs of doing so, but do not let that stop you.
Because, guess what? Nobody said that you can only have one capacity metrics app or you must have an app to take advantage of the data and information offered by the underlying semantic model. You can have an app hosted in a shared capacity used by all the actors for your regular monitoring and operations. And have another workspace without the app on a dedicated capacity only for exploring and automating your data extraction processes. With this setup, you avoid the aforementioned risks and costs and leverage the premium features of the dedicated capacities, such as XMLA endpoints.
Note: XMLA Endpoint capacity setting must be at least set to Read Only to allow the tools mentioned in the further sections of the article to connect to semantic models.

Let’s quickly examine the tools available once you have a capacity metrics workspace on an XMLA endpoint-enabled capacity.
SQL Server Profiler
SQL Server Profiler is the best tool for tracing and debugging semantic model events. It can record all events executing in a semantic model hosted on the Power BI service. This makes it ideal for studying and reverse engineering the visuals available in the metrics app by looking at the DAX queries they generate to populate the data.
It’s pretty simple to use and helps you understand the purpose of most of the tables and measures available in the metrics semantic model. Open the SQL Server Profiler, start a new trace, connect it to your metrics semantic model, choose the events you want to monitor (query events are sufficient), and you’re ready to go.

The SQL Server Profiler will trace and log the selected events as you interact with your metrics apps or report in the Power BI Service. You can play with the “Clear Trace Window” and carefully interact with one visual at a time to generate and trace the DAX query.
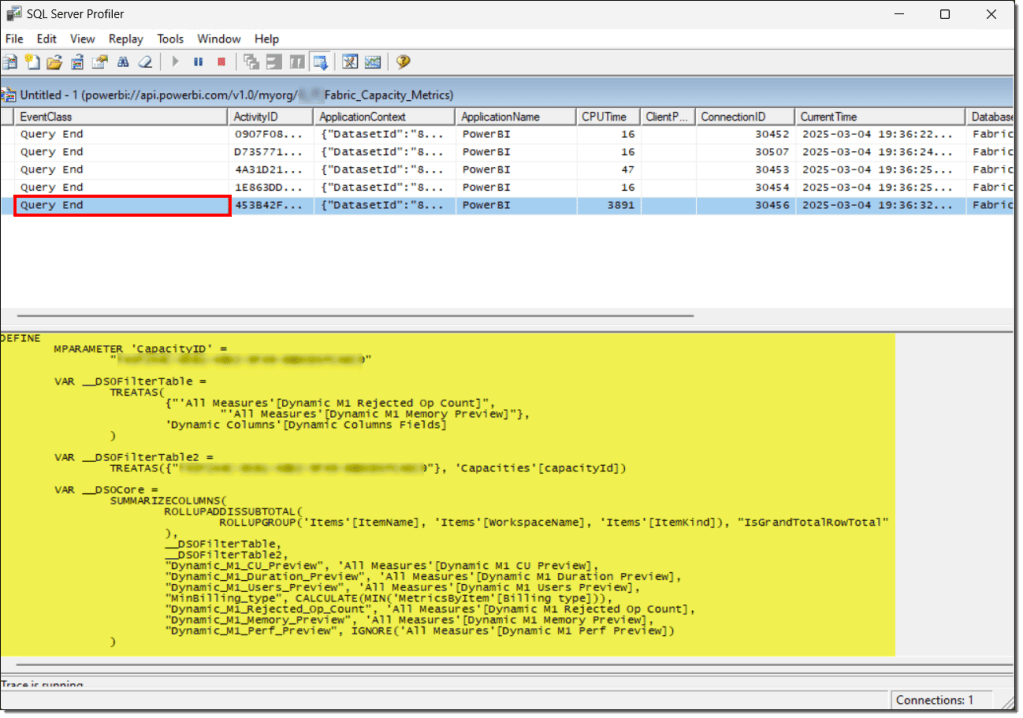
Take the DAX query to DAX Studio or Tabular Editor 3 to analyze and study the query further.
DAX Studio
DAX Studio requires no introduction for pro-Power BI users. The usual use case is to fine-tune and optimize your DAX measures. However, you can also use it to explore the DAX measures, tables, and relationships in a semantic model.
The metrics app visualizes the aggregated data, and the DAX query obtained from the SQL Server Profiler tells you the names of the DAX measures and tables used to build those visuals. Finally, DAX Studio lets you see the definitions of those DAX measures and peek into the tables to find the ones containing the unaggregated data at higher granularities.
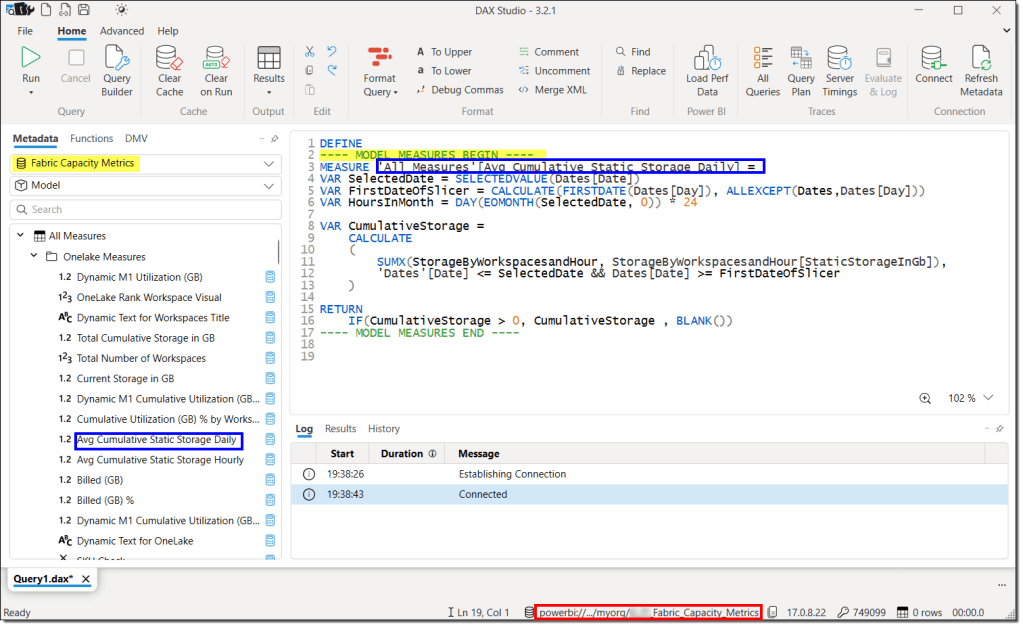
Once you have acquired a basic understanding of the metrics semantic model, you can start writing DAX queries to suit your needs and test them in the DAX studio to fine-tune the results and performance.
Tip: If you prefer to see a visual representation of the relationships, you should use Power BI Desktop.
Tabular Editor 3
Tabular Editor 3 is another third-party tool for exploring the metrics semantic model. It can define DAX measures, table structures, and relationships like DAX Studio. In addition, it can show the dependencies of a DAX measure with a click, simplifying the overall exploration effort. Getting a preview of the tables is also more streamlined and quicker than with DAX Studio. However, it comes at a cost and doesn’t do well for fine-tuning and optimizing the queries.

Note: Tabular Editor 2 isn’t suitable for exploring a semantic model. It cannot execute a DAX query and cannot show a preview of the tables.
Once a DAX query is ready to extract the desired data from the metrics semantic model, you can manually extract the data using any tool that can execute a DAX query.
Automation
Manual extraction is not the correct option to build custom KPIs or monitoring solutions based on the data extracted from the metrics semantic model. A more appropriate approach is to automate the process that runs at scheduled intervals to extract and store the data outside the metrics semantic model.
Storing the data ensures it is available for more than 14 days and can be blended with other sources. Let’s look at some tools and methods for automating the extraction process.
Semantic Link Python (SemPy) Library in Fabric Notebooks
SemPy library is the best tool for extracting data from a semantic model. If you can create a Fabric notebook and a lakehouse, you can automate the extraction process in minutes. There’s no other additional setup or configuration. In Spark 3.4 and above, it’s available in the default runtime. You don’t even have to write the command to install it.
Your metrics semantic model and the Fabric notebooks can be in separate workspaces. You only need to specify the workspace where your metrics semantic model is located, the semantic model, and a DAX query. In addition, It takes care of the authentication without you having to write a single line of code.

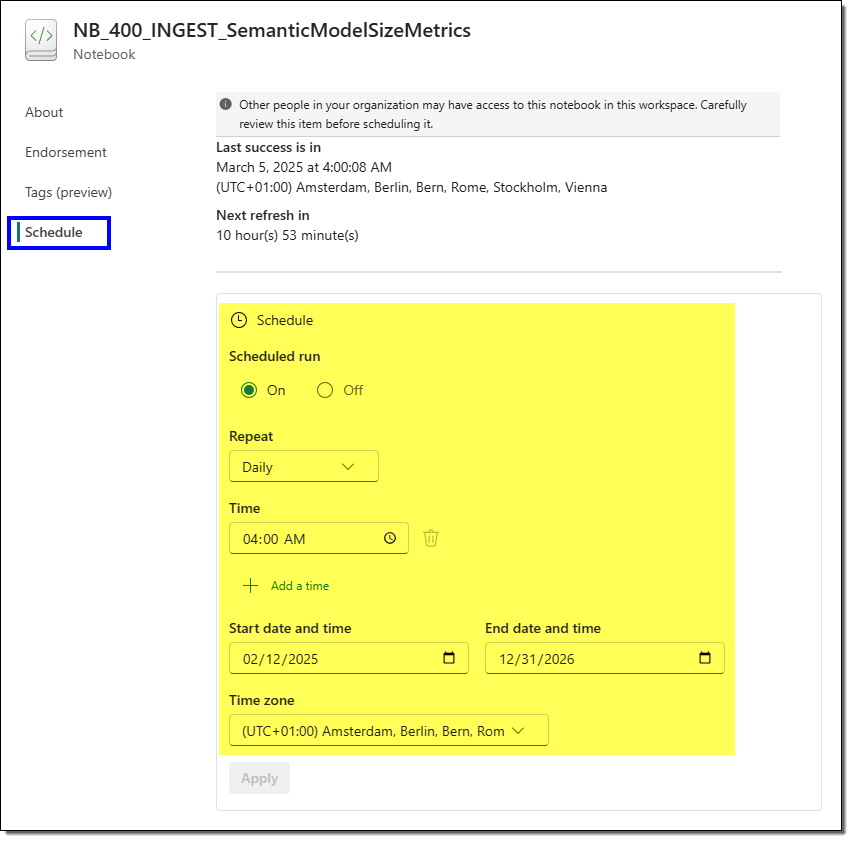
The notebooks offer rich scheduling capabilities, making them ideal for running scheduled jobs. Alternatively, you can use the Fabric Data pipeline to schedule the notebook runs or orchestrate the entire data storage and movement process.
However, the best deal is not the ease of setup and scheduling. The best part is that most SemPy functions use XMLA to connect and read data from the semantic model. Hence, the Power BI backend limitations (maximum number of rows, maximum data size, user level throttling, DAX queries only, etc.) do not apply to the SemPy function evaluate_dax(). Additionally, all requests are categorized as low priority to minimize the impact on capacity and are billed as interactive requests.
Want to see some examples? Check out the Next Steps at the end of the article.
DAX queries with REST APIs
The second option for automating data extraction from a semantic model is to execute DAX queries with REST APIs. Many tools support REST API calls, such as PowerShell, Python, Power Automate, etc. You could opt for any tool you feel confident with. However, remember that this approach is subject to Power BI backend limitations regardless of the tool used.
One common approach is to use a service principal to automate the process. If you decide to use a service principal, then there are a few configurational aspects and permissions that you need to take care of:
- Service principal requires build permissions to the semantic model, which means a workspace role other than “Viewer” or direct build permissions to the model.
- The service principal shall have the
Dataset.ReadWrite.AllorDataset.Read.AllAPI permissions in the Azure Entra ID (formerly Azure Active Directory).

- The following tenant settings must be enabled, or the service principal shall be included in the allowed list of both the settings: Semantic model Execute Queries REST API and Service principals can use Fabric APIs.
One positive aspect of this approach is that you can use it regardless of whether your Power BI workspace is hosted in a dedicated or shared capacity. Unlike the SemPy library, which requires your metrics workspace to be hosted in a dedicated capacity,
Depending on the tool, another downside of this approach is that it can be code-heavy, and you may have to write the code to handle the authentication. For example, with Power Automate, this approach is straightforward and doesn’t require any coding; however, you can’t use a service principal.
The most important thing to remember when hitching onto the Capacity Metrics semantic model is that the app is updated quite frequently. With each major update, the model’s structure, logic, and object names may change, which can turn your setup into a maintenance challenge.
You can continue using your existing DAX queries as long as you don’t update the target Capacity Metrics semantic model. However, this means you may miss out on new features or improvements introduced in newer versions.
That’s all for this article.
Conclusion
This article examined different tools and methods for connecting, exploring, and extracting data from the Fabric Capacity Metrics semantic model. We discussed the pros and cons of hosting the metrics workspace on a shared or dedicated server and how this affects the tools and connectivity options. We also discussed the Power BI backend limitations for executing the DAX queries with REST APIs and how to circumvent these limitations with the Semantic Link Python library for Fabric notebooks.
In conclusion, the SemPy library offers the best approach to automating data extraction using a Power BI semantic model.
Next Steps
The sample screenshot of the Fabric notebook demonstrating the ease of executing DAX queries with SemPy is from another article that continues this topic of data extraction. In this article, we present and discuss the detailed steps to extract and store semantic model memory consumption from the Fabric Capacity Metrics app daily. We use this information to build custom KPIs to monitor the growth of our semantic models over time and across capacities.
In another article, we demonstrate how to use Fabric Notebooks to track capacity unit (CU) usage for a DAX query and other interactive operations within a specific timepoint. We also discuss how to extend this approach to monitor CU usage across workspaces, capacities, and users.
In another article, we showcased how to extract the interactive and background capacity consumption percentages from the Fabric Capacity Metrics app. We extract the consumption ratios daily to build a custom monitoring solution that tracks capacity usage over time, identifies event-based patterns, and helps us decide when to set up a new capacity.

In another article, we extract and store the capacity throttling data on interactive delay, interactive rejection, and background rejection. We use this data to build custom KPIs to track and monitor the platform’s stability and availability over time.

Leave a comment