A short guide to monitoring Power BI Dataset performance and DAX queries in Power BI service

Power BI Desktop comes with an in-built Performance Analyzer to examine performance and DAX queries. However, there’s no equivalent tool to monitor performance or obtain DAX queries once the report is on the service. Or is there?
This article will show you how to monitor Power BI dataset performance and get the DAX queries for a report using SQL Server Profiler.
Performance Analyzer in the Power BI Desktop is a great and comprehensive tool to monitor, track, and debug bottlenecks in report performance. It neatly groups the various aspects of report element performance into tasks, such as visual display, DAX query, etc. Using Performance Analyzer is a recommended best practice for developers.
However, there are some scenarios where the Performance Analyzer alone is insufficient. For example, if your report uses a Live Connection to a Power BI Dataset or Analysis Services model, or there’s a DirectQuery involved. Throw in a VPN, and things aggravate. To rule out the connectivity factor, you need to measure the performance of the report in the service.
More on Performance Analyzer in Power BI Desktop here.
SQL Server Profiler
SQL Server Profiler provides an interface to trace and debug dataset events. Profiler was initially designed for SQL Server but also supports tracing and monitoring of Analysis Services and Power BI models. You’ll need SQL Server Profiler version 18.9 or higher to connect with Power BI datasets. SQL Server Profiler is commonly used to:
- Monitor the performance of an instance of the Analysis Services engine
- Debug query statements
- Identify queries that run slowly
- Audit and review activity that occurred on a dataset
- Display data about the captured events to the screen, or capture and save data about each event to a file or SQL table for future analysis or playback
Prerequisites
We will use the XMLA endpoint to connect to the dataset in the Power BI service. XMLA endpoint is a premium-only feature in Power BI. Therefore, the dataset should be hosted in a Premium workspace: Power BI Premium, Premium Per User (PPU), and Power BI Embedded.
Admin Settings: The following two settings shall be enabled in the Admin portal for XMLA endpoints to function. Confirm with your Power BI/capacity admin if you’re unsure or if this guide doesn’t work.
- Enable XMLA endpoint for the capacity: XMLA endpoint for the hosting capacity should be enabled and at least set to read-only. Read only is the minimum requirement to trace the dataset events.
- Allow XMLA endpoints and Analyze in Excel with on-premises datasets: The Power BI admins must enable this tenant-level setting; they can disable it for the tenant or a subset of users. You should be on the allowed list of users.
Access Rights: Build permission for the dataset you want to monitor.
How do you get the build permission?
Software: SQL Server Profiler is available in two flavors: an interface within the SQL Server Management Studio (SSMS) and an extension for the Azure Data Studio. Download and install the tool of your choice. In this article, we will use the SQL Server Profiler in SSMS. The methodology should be somewhat similar for the Data Studio extension.
Get the XMLA endpoint
XMLA endpoint is, in fact, a connection string, and Power BI workspaces have a connection string in the following URL format:
powerbi://api.powerbi.com/v1.0/[tenant name]/[workspace name]You can also replace the tenant name with myorg if your UPN is in the same tenant.
powerbi://api.powerbi.com/v1.0/myorg/[workspace name]Head to the Power BI Service and grab the Workspace Connection URL from the workspace settings. In workspace, Settings > Premium > Workspace Connection, select Copy.

Monitor Dataset
We can monitor the activities in a dataset by capturing and then analyzing the trace events generated by the dataset. DAX queries issued by the report to the dataset are also included in the trace events.
Launch the Profiler from the Windows start search or SSMS (Tools > SQL Server Profiler). If you’ve launched the Profiler from the SSMS, you can close the connect dialog box for now.
Create a New Trace
On the File menu, click New Trace, and connect to the Power BI dataset using the XMLA endpoint. Next, fill in the fields in the connect dialog box and hit Options.
- Server type: select Analysis Services
- Server name: enter the workspace connection URL (aka XMLA endpoint)
- Authentication: select Active Directory — Universal with MFA
- User name: enter your organizational user ID
Under the Connection Properties, type the dataset name in the Connect to database field and hit Connect.
Filling in the database name is mandatory for establishing a connection. Otherwise you’ll encounter a user does not have permissions to access the object error.

In the Trace Properties dialog box, fill the fields as follows and select Run. In this example, we will only use the bare minimum setup to get the DAX queries and check the query performance. For later analysis, you can save the traces as a file or as a table (in a database).
- Trace name: type a name for the trace
- Use the template: select a trace template on which to base the trace. For our example, we will use Standard (default)

The trace window appears, and as you interact with your Power BI report, the events appear in the tracing window. All the events are categorized into an EventClass and an EventSubclass. Refer to the Microsoft Docs for details about the event categories and the associated columns for each event.

Monitoring DAX queries
You’ll primarily see Discover Events and Query Events as you interact with the report. Query events help monitor the performance and contain the DAX queries. For example, select a Query End event with event subclass DAXQuery, and the associated DAX query will be available for copying in the bottom pane. It’s so easy!

You can quickly identify the slow-running queries by looking at the duration of the Query End event. Some columns of interest are:
- TextData: contains the text data associated with the query event, for example, DAX query, RLS role, etc.
- Duration: contains the amount of elapsed time (in milliseconds) taken by the event.
- CPUTime: contains the amount of CPU (execution) time (in milliseconds) used by the event.
- Error: contains the error number of any error associated with the query event.
- RequestProperties: contains the properties of the request.
Details of all the data columns for the Query Events can be found here.
RLS in the Wild
Power BI uses the EffectiveUserName property to send the current Power BI user credential to the dataset to execute the queries. When a new user accesses a report in Power BI. A new session initializes, invoking the RLS roles defined in the dataset. The TextData column shows the list of invoked RLS roles.

The EffectiveUserName property is set to the current user and sent to the Dataset as RequestProperties, along with all the Begin events.
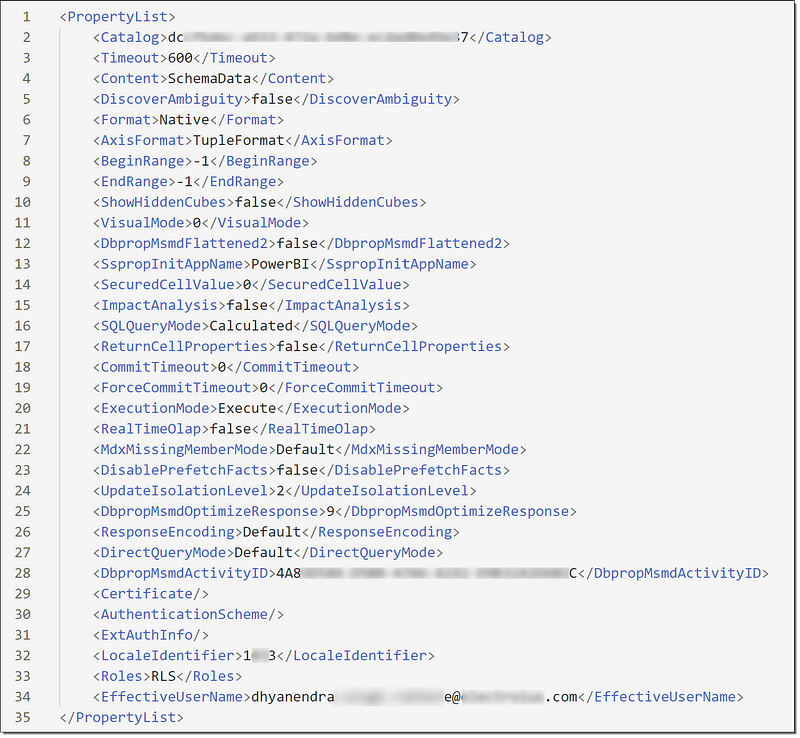
If you look at the DAX query in a Query Begin event, you’ll notice that the DAX is executed in a user context supplied by the RequestProperties. The XML properly list contains the EffectiveUserName property that the dataset engine uses to convert the request to the credential of the logged-in user after querying the Active Directory. Once the dataset engine gets the credential, the dataset returns the data the user has permission to view and access.

That’s all for now. As promised, keeping it short and straightforward.
Pro Tip
If you regularly need to use Profiler, consider using SQL Server Profiler templates. With templates, you can define the event classes and data columns to include in traces. Templates reduce the amount of data collected and time required to analyze the traces making your job easier. Here’s a link for further reading.

Leave a comment