A step-by-step guide to turning COVID-19 data into stunning Power BI visuals using Microsoft Azure offerings

Cloud, Big Data, and Business Intelligence are the three buzz words of the decade. Everyone is talking about them. Everyone wants to do it. But no one tells you how to do it. How do you use the cloud to process your big data and build intelligence around it to make business decisions?
There are multiple answers to that question, and in this guide, we tried to answer that question using Microsoft’s cloud solution (Azure) and Microsoft’s BI tool (Power BI) to get you started in the right direction.
Microsoft Azure is one of the leading cloud solutions providers, offering an end-to-end set of tools and techniques to ingest, analyze, and consume vast sources and formats of data.
In this series of articles, we will show you how can you use Microsoft data platform to ingest, transform and then build report on your data from scratch. These articles are perfect for someone who’s starting out his journey on Microsoft data technologies.
Prerequisites
- An active Microsoft Azure subscription
How to get an Azure subscription?
Background
The first step in the journey towards representing data in an easy, digestive, and usable form is recognizing the data’s source and format. Traditionally, data professionals focused on Extract, Transform & Load (ETL) to load and transform data. The advent of Azure has opened the doorway to process structure-less data on an unlimited and unprecedented scale. This change has shifted the transformation and loading data to Extract, Load & Transform (ELT). The basic principles and steps remain the same; they just follow a different order. A data project in Azure typically involves the following steps:
- Ingest: Identify the tools, technologies, and method to load the data
- Prep and train: Identify the tools, technologies, and method to transform the data
Followed by two additional steps to analyze and consume the cleansed data
- Model and serve: Identify the tools and methods to model and analyze the data
- Consume: Identify the tools and techniques to consume or present the data
In this article, we look at a holistic approach of transforming and loading data in Azure as we move through different phases of ELT until consumption with the aid of an example. To begin our journey, we will:
- Take publicly available COVID-19 data from GitHub (source)
- Store the CSV files to Azure Data Lake Storage Gen2 with the help of Azure Data Factory (ingest)
- Transform and cleanse the CSV files to relational data in Azure Databricks (prep and train)
- Store the cleansed data in Azure Synapse Analytics data warehouse (model and serve)
- And finally, present the prepared data in the form of Power BI visuals (consume)
Architecture
The following diagram provides a high-level visualization of our journey:

Data flow
- Fetch the CSV data from GitHub in the form of web pages using Azure Data Factory.
- Save the incoming data as CSV files in Azure Data Lake Storage.
- Leverage Azure Databricks to perform scalable analytics and achieve cleansed and transformed data (alternatively use PolyBase to clean, transform, and load directly to Azure Synapse Analytics data warehouse).
- Move the cleansed and transformed data to Azure Synapse Analytics data warehouse to combine with existing structured data.
- Build reports and dashboards using Power BI on top of Azure Synapse Analytics data warehouse to derive insights from the data.
Components
- Azure Data Factory: a hybrid data integration service to create, schedule, and orchestrate ETL and ELT workflows
- Azure Data Lake Storage: massively scalable and cost-effective storage for unstructured data, images, videos, audio, documents, etc.
- Azure Databricks: fast, easy, scalable, and collaborative Apache Spark-based analytics platform
- Azure Synapse Analytics: a massively parallel processing architecture based scalable and elastic cloud data warehouse that brings together enterprise data warehousing and Big Data analytics
- Power BI: a suite of business analytics tools to deliver insights from hundreds of data sources, simplify data prep, and drive ad hoc analysis
The next step is to set up the resources and components we need to finish our data project. In a typical setup, a data engineer may perform a few routine tasks:
- Provision: provision data platform technologies to store the data
- Process: create data processing pipelines to move data between various data stores
- Secure: ensure that the data is safe and protected from unauthorized access and cyber attacks
- Monitor: set up proactive and reactive monitors and alerts to ensure that the solution meets the required performance, availability, and cost limits
- Disaster Recovery: ensure that there is the ability to recover data in the event of a disaster
In this guide, we focus on provisioning and processing as other tasks are beyond our project’s scope. Let’s dive in.
Create a resource group
In Azure, every resource belongs to one and only one resource group. A resource group is a logical grouping of resources to simplify management, access, cost, etc. Our resource group will hold all our provisioned components.
Sign in to the Azure Portal. In the upper-left corner, select + Create a resource, search for Resource group, on the new blade, click on Create to start the creation process. On the Create a resource group blade, select the subscription you’ll use for this project, type a name for your resource group, and select an appropriate region from the list.
A blade refers to a pane in the Azure portal.


You are free to choose a name for your resources; however, it’s a good practice to follow the naming conventions.
Create an Azure Key Vault
Azure Key Vault is a tool for securely storing and accessing secrets. A secret is anything that you want to tightly control access to, such as API keys, passwords, access tokens, or certificates.
Search for Key vault similarly as we did for resource group (steps 1–3) and fill in the settings as shown, leave the rest as default, notice that our resource group is available for selection in the dropdown.

Create Azure Data Factory
Search the Azure portal for Data Factories and fill in the settings as shown; leave the rest as default.

Provision Azure Data Lake Storage
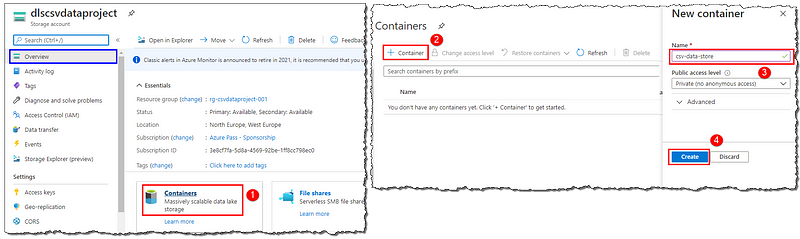
Search the Azure portal for Storage account and fill in the settings as shown; leave the rest as default. An important point to note here is the hierarchical namespace offered by Azure Data Lake Storage Gen2 built on top of the low-cost Azure blob storage. A hierarchical namespace organizes objects into a hierarchy of directories for enhanced performance, management, and security.

Select the Notification icon on the toolbar to see the progress of the creation. After it deploys, you get a popup notification. Use it to go to the newly created resource. On the Overview page, find the Containers option; we will use it to make a container that will act as a repository to store the downloaded files. Follow the steps shown to create the container CSV-data-store. Open the new container by clicking on it, create a new directory by selecting + Add Directory, and name it as covid19-data; this folder will hold our files.
Create an Azure Databricks Workspace
In the upper-left corner, select + Create a resource. Select Analytics > Azure Databricks to start the creation process, fill in the settings as shown.

Create a data warehouse in Azure Synapse Analytics
In the upper-left corner, select + Create a resource. Select Databases > Azure Synapse Analytics (formerly SQL DW) to start the creation process, fill in the settings as shown. We have successfully created a data warehouse in Azure Synapse Analytics.

One Server, Many Databases
When we create our first Azure SQL database, we also create an Azure SQL (logical) server. Think of a server as an administrative container for our databases. We can control logins, firewall rules, and security policies through the server. We can also override these policies on each database within the server. For now, we need just one database.
Once the deployment has finished, go to the resource to open the Overview page for our new database. Explore the database details on the Overview page; we’re particularly interested in the Server name and Connection strings. We will need these later to connect to our database.

Set up Microsoft Power BI
Microsoft Power BI exists outside the Azure offerings in three different pricing flavors — Desktop, Pro, and Premium. The desktop flavor is free for individual users and perfectly suitable for our exercise. Download and install the Power BI Desktop from the Microsoft store.
That’s all for now, folks. Grab a coffee, and we will continue with the detailed processing steps at various components in our subsequent series of articles.
Conclusion
We looked at the new era’s ETL process and the tasks a data engineer has to perform. We presented and discussed a data engineering project and set up Microsoft Azure components to build our project.
Next steps
Follow our subsequent articles to build your project concurrently with us. We will discuss and explain the processing at all the components in detail.
Ingesting files with Azure Data Factory
Cleansing and transforming CSV files in Azure Databricks
Loading data in Azure Synapse Analytics by using PolyBase

Leave a comment